
We are living in one of the most divisive times I can ever remember when it comes to politics. It seems no matter what happens people are going to be angry and frustrated and there is really nothing that can be done about it. These are just the times we live in, fear and fervor are magnified by social media and the financial entertainment industry (the so called news industry). Headlines, ratings, and fake news dominate our daily lives and it is very difficult to separate fact from fiction with any degree of accuracy.
For investors, this is an especially tricky time because we not only have to worry about our political ideology and what we want for our country, but also about our portfolios and financial health. As investors we have a tendency to associate politics and government with stocks, bonds, and markets, but is this really a proper association? Every four years about half of the country is severely disappointed and have a negative view of the next four years. But markets don’t crash half the time, every four years, or when a new party takes control.
So how should we go about analyzing this election, and future elections, from an investment and market perspective? How do we stay objective? In my opinion, there is only one way to wrap our minds around this topic and stay objective, by using history as our guide.
I already know what you are going to say…………..”it’s different this time”
Yes, it is. It is always a bit different and no two events are ever exactly the same, including Presidential elections. But, what is not different, and will likely never be different, is how people react to elections and the steps they take following elections. Are people going to continue to buy things? Are businesses going to continue to invest in the future? Are our wants and needs any different than they were before the election? It is these actions that drive markets and investments.
To quote Sir John Templeton:
The four most expensive words in the English language are, “This time it’s different.”
Now for the disclaimer:
Delphi Advisers is not affiliated with any political parties, we are politically agnostic and we do not cast our vote for any particular party. If we had a vote, it would be for markets.
On to the analysis!
As I eluded to above, people have a tendency to believe that when the opposing party is in power that the country, and the financial markets, are all going to “go to hell”, and this is a very understandable position. The problem is that history would disagree. Markets tend not to really care what party is in office and they have a very strong track record of growth with either party in power. The reason for ubiquitous growth is that markets price in any major legislation on the horizon, but for the most part the structure of our government creates gridlock; markets love gridlock. The only time political risk really rises to the forefront is when there is a super-majority, or close to it, of 2/3rds control of both the house and the senate along with, of course, full control of the executive office.
Lets dig into the numbers:
From 1926 to 2019 we have seen the completion of 94 calendar years and 69 of those have resulted in positive total returns for the S&P 500, that’s approximately 73% of all years. Pretty decent results. Democrats have held the Presidency for 50 of those years and Republicans for 44. Republican Presidents have had positive S&P 500 returns in about 71% of years and Democrats in about 76% of years, a slight discrepancy but not statistically significant. When a single party has the Presidency and control of both the senate and house, we have seen positive S&P 500 results in about 70% of years and when we have a mixed government, we see positive results in about 76% of years. Again, a slight discrepancy but not really statistically significant given the small sample size. (see exhibit 1 below)
Exhibit 1: S&P 500 Political Score Card
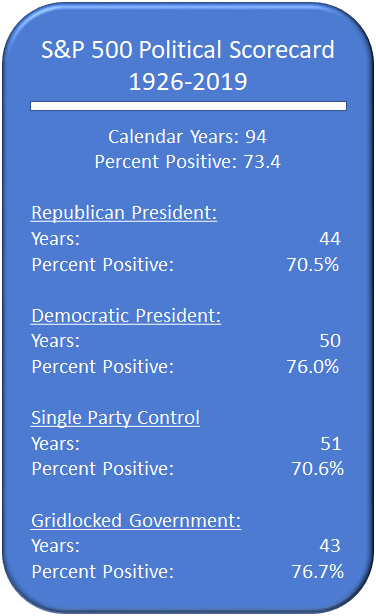
The one anomaly we tend to see is when we have a Democrat in the Presidents’ seat and Republicans control at least one branch of Congress. This composition has resulted in positive returns about 79% of the time. This appears to be a solid trend but nothing to write home to mom about, given that there are only 14 years of the last 94 that this has taken place.
We have only seen a true super-majority during two Presidencies, FDR (D), during the Great Depression for four years, and Lyndon B. Johnson (D), for two years in the 1960’s. Market returns during the Great Depression were erratic and the political risk was far higher during this time than we have ever, or likely will ever, experience again. Although the majority of President Johnson’s legislation was focused around Civil Rights and voting rights, the super-majority he enjoyed in 65’ and 66’, as well as the “close too” super-majority he had during his entire Presidency, allowed him to have fairly sweeping authority. Specifically, he ratified the Gulf of Tonkin Resolution which allowed him to drastically increase American involvement in Vietnam and ultimately pushing France to withdraw from NATO. These actions contributed to a rough 1966 in the markets with the S&P 500 falling about 10%.
Politics are incredibly divisive in nature and have many far-reaching affects on our lives. That being said, politics just don’t have the massive impact on financial markets that people think they do. What we need to be on the lookout for is massive, sweeping legislation that affects things like property rights or the redistribution of wealth. Other than that, don’t let your bias (we all have one) affect your investment decision process, it will make you poor!
Be disciplined, data driven, and unattached emotionally!
S&P 500 returns provided by https://www.slickcharts.com/sp500/returns. Presidential and Congressional composition provided by https:// www.infoplease.com/us/government.