
If you are anything like we are here at Delphi you have been following the saga of monetary policy for many years, but what exactly does it all mean? Did Quantitative Easing (QE) work? Was lowering the Fed Funds Rate the right move? What is the deal with this yield curve inversion?
Today we are going to dive into the monetary policy that has taken place since the great recession and see if we can’t make some sense of it.
We apologize in advance, this is a bit long.
Laying the Foundation
Let’s start with the basics, interest rates and how they are set. When people talk about interest rates as a general term it is very difficult to figure out what exactly they are referring to. There are a myriad different types of interest rates including mortgage rates, savings rates, bond rates, certificate of deposit rates, etc, etc, etc. There are so many different types of interest rates that it can get a bit confusing. Most people talk about retail rates like mortgages and savings accounts but retail rates are typically based on another set of rates that are derived from market operations or auctions, such as the Federal Funds Rate. When we discuss interest rates, we will focus on the Federal Funds Rate and the rates associated with different maturities of Treasury bonds and notes, almost all other rates are based in some fashion on these rates.
Let’s take a moment and define what the heck these rates are and why they matter.
The Federal Funds Rate is the only rate that our government, specifically the Federal Reserve, has any real control over. When you hear Jerome Powell, head of the FED, speak about changing the interest rate he is talking about the Fed Funds Rate. The Fed Funds Rate is the rate that banks loan money to one another on an overnight basis. Most other short-term rates are based off of this rate to some extent.
The other important set of rates are Treasury rates, or said differently the Treasury yield curve. The Treasury yield curve is the yield, or rate of interest, different maturities of treasury bonds and notes pay the investors who purchase them. Typically, lower rates of interest for shorter maturities and higher rates for longer maturities, as people require a higher return to give their money to our government for a longer period of time. These rates are set through auctions to the public. The higher the demand for these securities the lower the rate paid to the investor, and vice versa. Treasury yields are considered risk free investments and the basis for other types of riskier bond and loan rates.
So why are these rates so important? Its actually rather simple but for some reason pundits like to over complicate it. Banks make money by taking deposits and paying their depositors the short rate, based off of the Fed Funds Rate, and lending money out at long rates, based off of Treasury rates. If the gap between short-term rates and long-term rates is large then banks make more money, if its small banks make less money. This is referred to as the steepness of the yield curve. A steep yield curve implies solid bank profitability and banks will be incentivized to make loans and push money into the system. A flat yield curve implies low profitability and banks will only lend to high quality borrowers because they cannot make enough money to offset the risk of default associated with low quality borrowers. Less lending means less money in the system.
Thanks for getting through that with us, we know its dry but we need a solid foundation to understand the consequences of monetary policy. Now on to the fun stuff
Great Recession Era FED Policy:
As we got into the depths of the great recession the FED made two major policy decisions that have shaped the current state of the economy, lowered the Fed Funds rate to near zero, and embarked on QE.
Lowering the Fed Funds Rate made sense based on what the FED tries to accomplish, because it will steepen the yield curve, incentivizing bank lending, and lower short-term borrowing costs to help companies and banks get needed liquidity. However, the FED then wiped out all the positive effects of low short-term rates by starting QE.
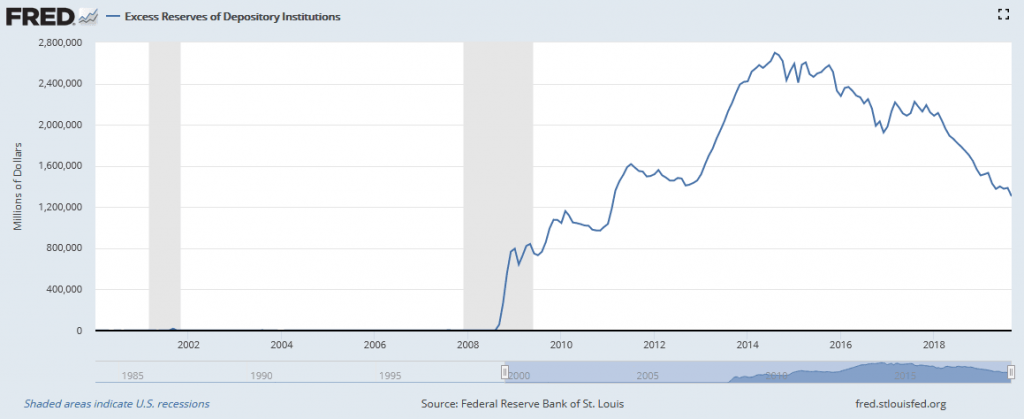
QE was meant to be stimulus and get money into the system but that never happened, why? Well, its pretty simple really. The QE program was supposed to inject money in the system by purchasing long term bonds from banks to be loaned out to the public. Unfortunately, when you increase demand for bonds you put downward pressure on long rates and flatten the yield curve. What we learned from earlier is that banks don’t make much money with a flat yield curve and won’t lend as much money out. This is exactly what happened as long rates plunged right along with short rates. Ultimately, banks were just sitting on all the reserves and not putting the money to work. The graph below shows the excess reserves that have been accumulated since QE began.
Oddly enough, anyone who understand how basic economics work could have predicted this result, yet the “smartest” people in world couldn’t see it? Confusing at best. We believe this poor policy is why the recovery took so long and contributed to the widening of the wealth gap. High-quality credit, the wealthy and large corporations, got all the liquidity and lower quality credit, your average family, got nada!
Policy of Today
Alright, so great recession era policy didn’t do us any favors, but the past is the past, no reason to dwell on it. Let’s take a look at what’s been going on the last few years.
Flashing back to 2016 the Federal Reserve starts to raise interest rates and reverse some of wrongheaded QE that they enacted, hooray! Well, not so fast. Because they are doing these things at the same time the are putting upward pressure on short rates AND long rates, as more long-term bonds enter the system and demand stays the same. The steepness of the yield curve remains unchanged and banks still don’t want to lend enough to get this recovery clicking at a higher rate. It gets worse, the FED continues to raise rates but the reversing of QE is not happening as fast as needed so the yield curve begins to flatten and dis-incentivize lending even more. As of the end of 2018 the FED owned a little less than 900 billion worth of treasury bonds that mature in 5 years or more, that’s almost 15% of all outstanding treasuries with similar maturities. If they would just put those securities back in the system, we would see the yield curve steepen almost immediately.
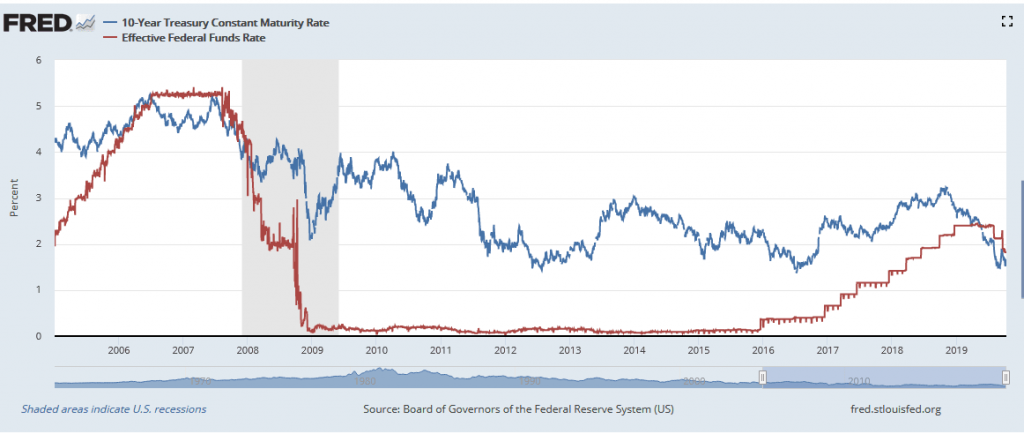
Instead of taking common sense action and working to incentivize lending the FED continued its idiotic policy and caused the yield curve to actually invert earlier this year, as the Fed Funds Rate went above the 10-year treasury rate. This is important because an inverted yield curve can have drastic economic effects as banks lend even less and liquidity gets strangled. The graph below depicts the Fed Funds Rate and the 10 year treasury yield.
Flashing forward to today, the FED has stopped the reversal of QE and lowered the Fed Funds Rate. Since this has taken place, we have seen long rates fall even further and the yield curve wobble back and forth from flat to inverted. It is Just baffling.
Monday Morning Quarterback
In our view, the FED never should have embarked on QE to start with, as it slowed the recovery significantly by dis-incentivizing lending. Since we have no power to change the past our suggestion to the FED is to focus policy on the steepness of the yield curve and not on manipulating long rates. When the economy slows cut the Fed Funds Rate to steepen the curve. When inflation heats up, raise the Fed Funds Rate to flatten the curve and curb lending.
The policies of the past decade have been nothing but a hindrance to recovery and contributed to a widening of the wealth gap. Stop it!
Federal Reserve balance sheet data provided by the Federal Reserve Bank of St. Louis and goa.gov.