
Introduction to The Market Myths Series.
Markets of all kinds are going through a severe correction that is incredibly scary for many investors, especially those who are in or nearing retirement. Believe me when I say that I empathize and understand how hard things are right now. I have spent hundreds of hours over my career helping clients get through times such as these, which is why I know how frustrating and unsettling this situation can be.
During periods of market volatility, fear mongering by the media and government only makes things worse. Unfortunately, both the media and government officials use cherry-picked data, half-truths, omissions, and even outright lies to create as much panic as possible. The media hopes this panic will manifest in higher ratings while government officials hope that they can pose as heroes to gain future votes or get re-appointed. You may have heard the old adage, “never let a good crisis go to waste”. This may seem cynical, but, unfortunately, it is true. All we need to do is look at history.
So, over the next couple weeks, we are going to write a series of five articles aimed at debunking these myths and false narratives pushed by the media and government. The goal of these articles is to give investors perspective and context as to what is going on and perhaps even some tools to navigate through this sort of instability in the future (yes, it will happen again).
These articles will be written from a politically agnostic point of view and will include as much objectivity as possible. We do not favor any specific party and we have no political affiliation. Our job is simply to approach these topics from a market and investment perspective in order to help investors and clients cut through the noise and look at the facts.
Outlined below are the coming articles listed in order of release:
- Inflation is Bad for Stocks
- A Recession is Imminent
- The Federal Reserve Can Stop Inflation
- You Shouldn’t Own Bonds During Times of Inflation
- Taxing Windfall Profits of Oil Companies is Good for The Economy
For now, let’s start with:
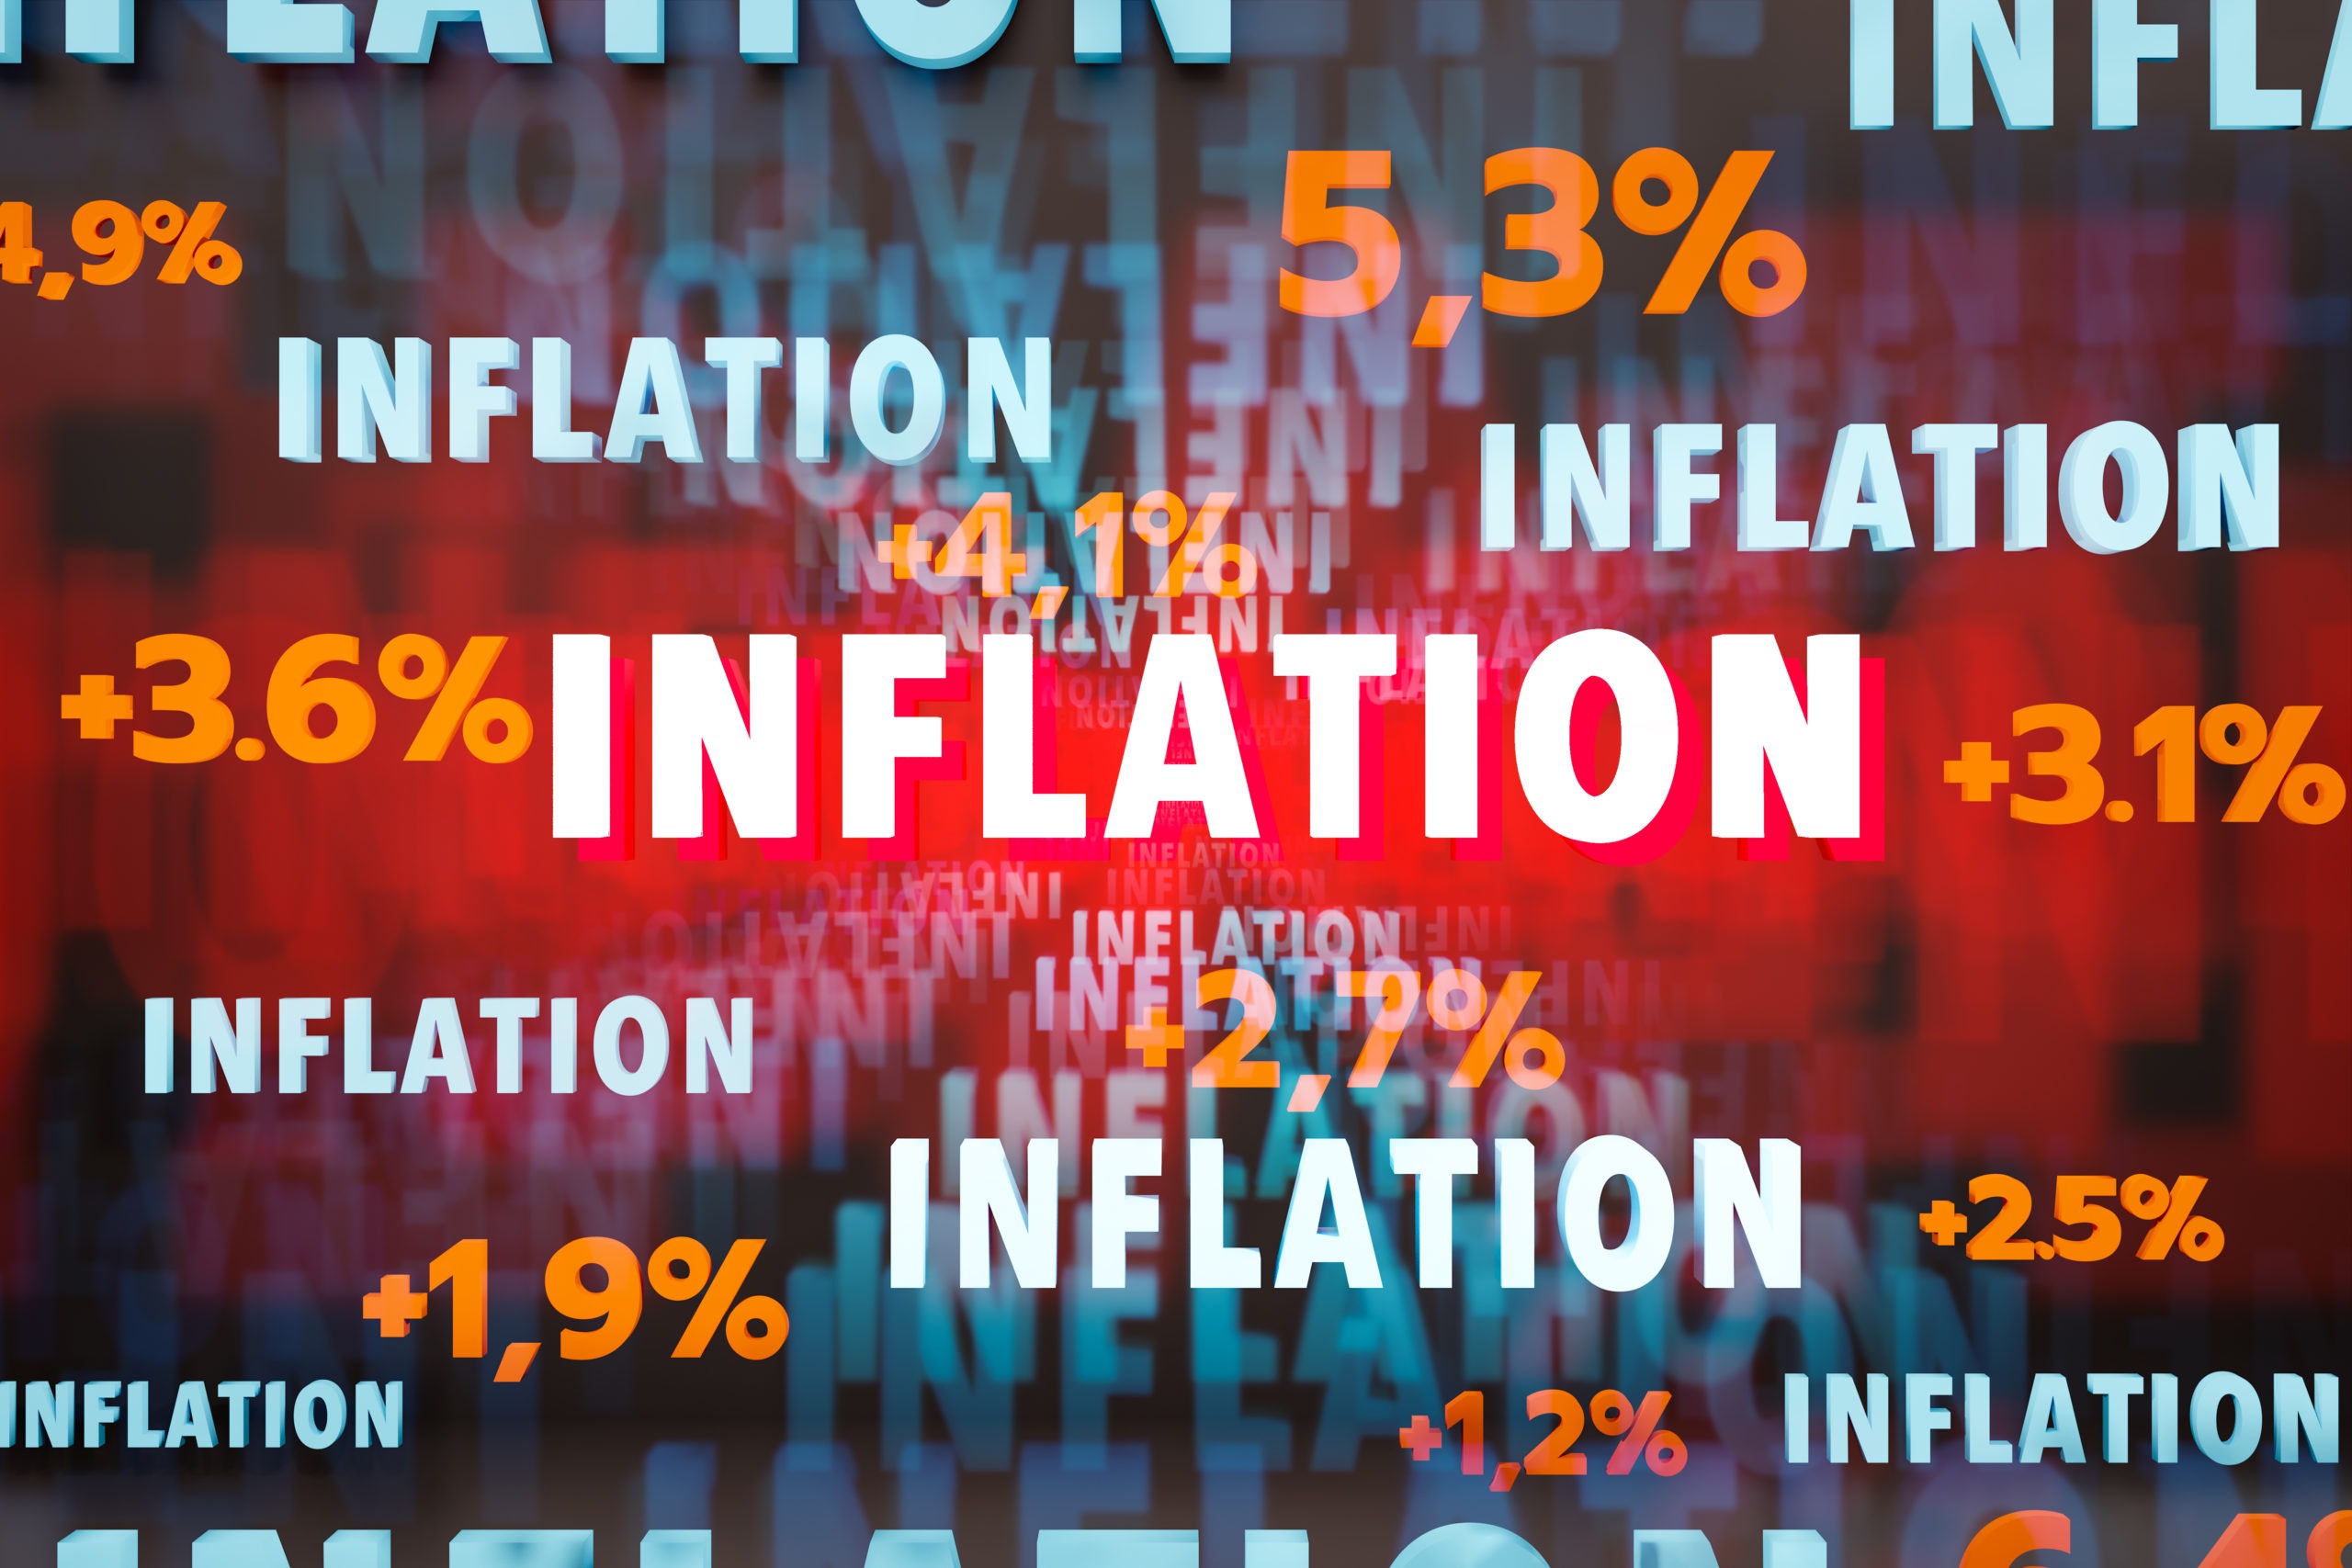
Myth 1: Inflation is Bad for Stocks
First and foremost, it’s important to note that nobody likes inflation except for governments with heavy debt that can decrease the real value of their outstanding debt and make it a bit easier to repay. For the rest of us, inflation is difficult to deal with and can directly hurt our pocketbooks. The effects of inflation are felt at a much higher magnitude in the lower socioeconomic strata of the world as the goods that are typically most subject to inflation are consumer goods, specifically staples.
But is inflation bad for investors?
In general, inflation is not “good” for investors as it dampens the real returns of any investment, but how “bad” really depends on what kind of investor you are. If you are heavily invested in things like bonds or insurance products, then inflation is going to be incredibly difficult for you as every dollar that gets paid from an annuity or a bond coupon becomes less and less valuable every day.
Recently, however, the narrative being spun by the media is that “inflation is bad for stocks” or maybe you have heard it as “stocks don’t like inflation”. But is this narrative true? In the current market environment, with stocks down over 20% at the time this article is being written, it seems hard to argue against this ubiquitous message being distributed across global media outlets. However, we do have the ability to use history as our guide and dig into the truth of this narrative.
Throughout modern history, we have dealt with two major bouts of increased inflation. These periods were from 1941 to 1947 and from 1968 to 1982[1]. Lets take a closer look.
1941 to 1947:
In 1941, inflation began to creep up as World War II came into full swing. Although inflation showed itself in fits and starts, it peaked at an annualized rate of 18.10% in 1946[2] and averaged 6.96% over this seven-year period, which deteriorated overall purchasing power by approximately 51.7%[3]. To give some context, that is roughly the same amount of total inflation as the 20-year period from 2000 to 2020.[4]
So, how did stocks do during this time period?
Although there were two pretty tough years in the stock market during this seven-year period, with 1941 and 1946 both delivering negative returns, the S&P 500 had a total return of 105.74% (or 10.86% annually).[5]
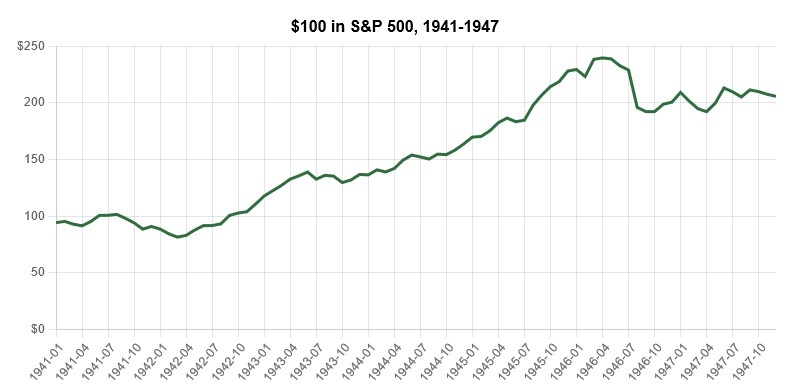
That is above the long-term annual average of the S&P 500, which is 9.73%.[6] So, it seems, in this particular case, that stocks did pretty well despite the difficult inflationary environment.
However, we can’t just stop here, one case does not make a rule or give us any reasonable guidelines to navigate the future. We must dig deeper.
1968-1982:
The second major era of inflation was twice as long as the bout that occurred from 1941 to 1947. This second period of inflation ran from 1968 to 1982 and was rife with economic, political, and societal events that all contributed to the prolonged inflation we experienced here in the US. After having an extended period of below 2% inflation, we saw it tick up over 4% in 1968 and, by 1974, over 11%. During the following eight years, inflation fell below 6%, returned to the double digits three times, peaked at 13.55% annualized in 1980, and finally returned to below 4% in 1983.[7] During this period, inflation averaged 7.37% per year and deteriorated the purchasing power of consumers by 177.30%[8], a little less than the 202.90% we would experience over the subsequent 40 years from 1982 to 2022[9].
If you were invested in stocks during this time, you actually came out okay, as the S&P 500 gained a total of 181.59% and averaged about 7.15% per year.[10]
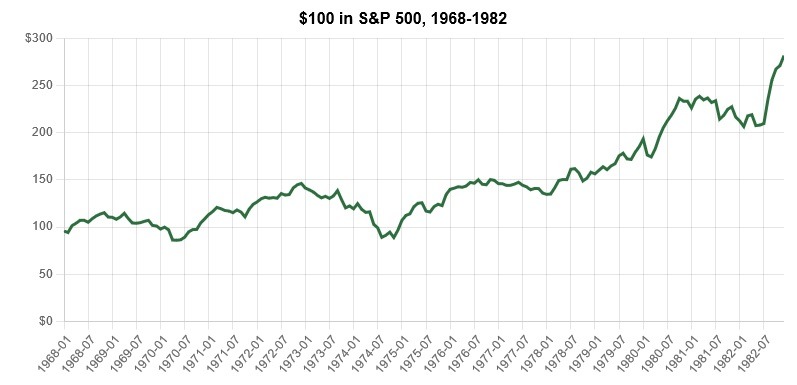
This is below the long-term average of the S&P 500, but is still a very positive return and far better than most other asset classes. As a comparison, one of the worst 20-year periods we have ever seen in the S&P 500 returned 5.69% annualized from 1999-2018, totaling 202.21%[11], which, anecdotally, was a time of minimal inflation.
If you were an investor during this period of time, it is likely that you owned your own home, had a little wealth built up, and practiced slightly different consumer behaviors than the average American. This is an important point because, as mentioned earlier, inflation is much harder on the lower socioeconomic class than it is on the upper and middle classes. Meaning, investors during this time period were likely middle or upper class and, as a result, experienced a much lower “personal” rate of inflation than the average American captured in the inflation data. Think about it this way: the wealthier a family is, the lower the percentage of their income being spent on the products that are most highly subject to inflation, such as consumer staples, food, and gas. High-margin luxury goods and services are much less effected by inflation because materials and the cost of production are a far lower percentage of their overall cost than they are for low-margin goods like consumer staples. Therefore, inflation adjusted returns were likely higher for investors than what the numbers portray. For the lower socioeconomic class, this is a very sad reality, but reality, nonetheless.
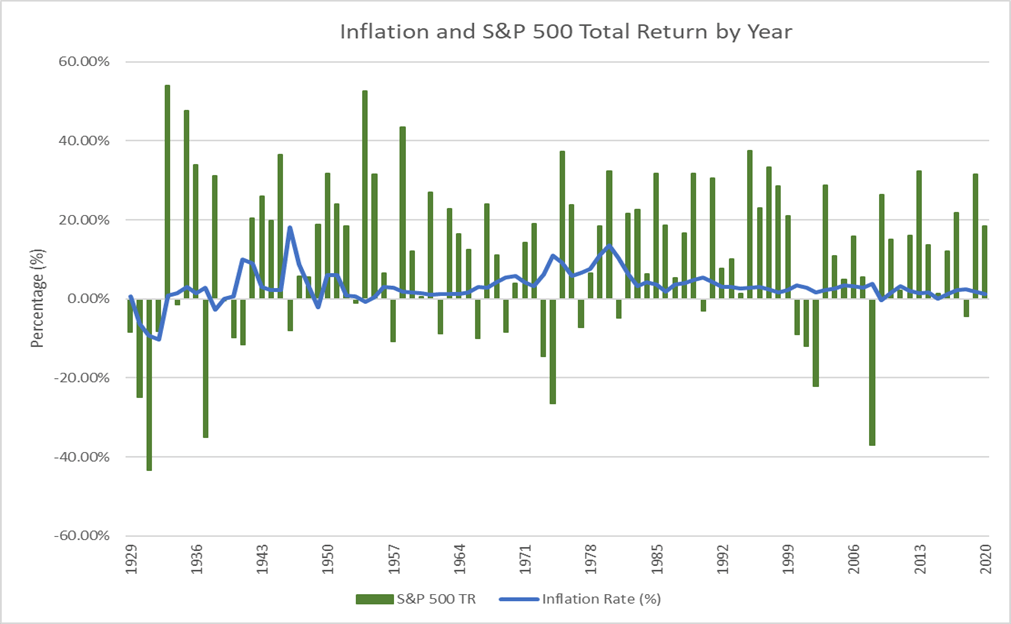
Inflation and Stocks in Modern History
The graph below depicts the annual inflation rate and the S&P 500 total return by year from 1929 to 2021. As we take a look at the overall relationship between stock returns and inflation, it appears that there really isn’t any. Meaning, stocks tend to perform pretty well in all sorts of different inflationary environments. The only real takeaway from this graph is that stocks really didn’t seem to like the deflation that took place during the Great Depression, but that is far too small of a sample size to use to make any future predictions.
This doesn’t mean that stock markets won’t experience volatility when inflation rises. Inflation can be scary and, in the short-term, stock price action is driven by sentiment and emotion. We would all do well to remember a quote from legendary investor, Benjamin Graham:
“In the short run, the market is a voting machine but in the long run, it is a weighing machine.”
Why do stocks deal well with inflation?
There is a major misconception among retail investors and the media regarding what a stock really is. The common perception is that a stock is a highly volatile investment instrument that reflects how a country is doing economically, but this is incorrect. A stock is ownership of a company that produces goods and services, which the public consumes. Thus, if you own a stock, you own a share of a company’s revenue and earnings that cannot be captured by daily price volatility. If inflation rises, people panic and short-term fears tend to overwhelm long-term logic. As a result, we forget that these companies are going to continue to sell products and services and, when their prices rise, they will, in most cases, just pass those costs on to the public to remain profitable. In addition, companies are able to cut costs or invest in productivity-enhancing technology and other processes that keep them profitable. As an investor you own a percentage of all this innovation and production.
A stock is not a house, commodity, bond, or cryptocurrency that produces nothing and has no revenue stream. A stock is a living, breathing company that is continuously striving to maximize profitability and return value to all its stakeholders. This is the reason that stocks have very few competitors when it comes to long term investor returns in any economic environment.
What does this mean for your portfolio?
In general, now is a time for the vast majority of investors to demonstrate calm, patience, and discipline. Price action and volatility can be very trying for all investors, but especially for those that are in or nearing retirement. However, short-term changes in prices are not a reason, in and of themselves, to make portfolio changes. Market corrections can happen for any reason or even no reason at all, as short-term prices are a series of irrational overreactions to both the upside and the downside. If you have a well-laid-out financial plan and have built a portfolio strategy to support that plan, then hanging tight and staying disciplined is the right thing to do, even if the markets fall further before they ultimately recover.
The only exception to this general rule is if your investments are in expensive, cumbersome vehicles like insurance products, mutual funds, or private placements. When markets are up and mundane, these products can give a decent return and do “okay” in general market conditions. However, when markets are down +20%, there will eventually be a hard and fast bounce to the upside and the products mentioned above are just not efficient enough to capture all of the upside that the markets have to offer. Creating efficiencies now, before the recovery, can add exponentially to long-term returns.
Not sure if you are invested in an efficient, diversified portfolio? Please feel free to get in touch with us. We would be happy to do a portfolio analysis for you, free of charge.
Next – Market Myths Series #2: A Recession is Imminent
Footnotes:
[1] https://www.thebalancemoney.com/u-s-inflation-rate-history-by-year-and-forecast-3306093
[2] https://www.thebalancemoney.com/u-s-inflation-rate-history-by-year-and-forecast-3306093
[3] https://tools.carboncollective.co/inflation/us/1941/100/1947/
[4] https://tools.carboncollective.co/inflation/us/2000/100/2020/
[5] https://www.officialdata.org/us/stocks/s-p-500/1941?amount=100&endYear=1947
[6] https://www.officialdata.org/us/stocks/s-p-500/1929?amount=100&endYear=2021
[7] https://www.macrotrends.net/countries/USA/united-states/inflation-rate-cpi
[8] https://tools.carboncollective.co/inflation/us/1968/100/1982/
[9] https://tools.carboncollective.co/inflation/us/1982/100/
[10] https://www.officialdata.org/us/stocks/s-p-500/1968?amount=100&endYear=1982
[11] https://www.officialdata.org/us/stocks/s-p-500/1999?amount=100&endYear=2018