
Over the last few months, we have seen a pretty drastic change in not just the policy stance of the Federal Reserve, but how the organization is viewed and being used as a prop by our elected officials. With midterm elections around the corner, the Republicans are trying to position the Federal Reserve as an organization that is doing everything it can to mitigate the last 18 months of “economically devastating policy that caused all this inflation.” Meanwhile, the Democrats are trying to plant the seed of: if inflation persists, it’s the fault of the Federal Reserve and not the policy and ideology of the current political majority.
One cries wolf, while the other begins the long process of blame shifting. Honestly, both of these moves are politically shrewd and historically effective, regardless of the fact that neither position has any real truth to it.
Instead, the real questions we should be asking are: Is there anything the Federal Reserve can actually do to curb inflation? Why would they go along with all this and continue to allow themselves to be used as a political pawn?
As with all things that involve economics and politics, the answer is complex and not as clear and concise as we would like. However, we can take a deep dive into the data and explore what inflation really is, what tools, if any, the Federal Reserve can use to fight inflation, and why the Federal Reserve continues to allow itself to be part of this broken political gameboard.
What is Inflation?
In order to have a clear discussion about this topic and analyze how inflation can be tamed, we need to understand what inflation is. As an aside, it is very fitting that this article is in the Market Myths series because inflation itself has more myths surrounding it than any other topic I have ever researched or written about. It is a topic that is full of misinformation and misunderstandings. From minimum wage to taxes to immigration, there are theories about how all these things, plus a million more, are the true causes of inflation.
There are kernels of truth to these issues having effects on overall inflation, but these theoretical items on their own don’t really have the scope to cause or describe inflation on a macro level. Instead, all these tiny factors adding up in a way that causes inflation on a large scale is incredibly vague and complex. I tend to subscribe to the scientific principle of Occam’s Razor, which roughly states that all else being equal, the simplest answer tends to be the correct one.
No one has ever had a simpler and more accurate description of inflation, in my opinion, than the 1976 Nobel Prize winning economist, Milton Friedman, who said:
“Inflation is caused by too much money chasing after too few goods.”[1]
Is this definition oversimplified? Of course. But there is some genius in that simplicity. Dr. Friedman was alluding to the notion that inflation only happens when the growth of the money supply outpaces the growth of the supply of the goods that money is being used to purchase. I phrase this very specifically as “supply and supply” rather than the more traditional “supply and demand” because, on the demand side, growth of the money supply itself is what causes the artificial increases in demand that result in inflation.
So, based on this definition, there are two factors that can cause inflation on a macro level:
- Increase in the supply of money that results in excess demand
- Decrease in the supply of goods that results in shortages of said supply
Each of these factors individually, or in combination, meet the definition laid out by Dr. Friedman.
The Money Supply
Even though Dr. Friedman’s definition is simple and effective, it leaves us in limbo when it comes to understanding what the money supply is, how it grows, and why.
Since 2008, our government has embarked on what is referred to as Quantitative Easing or QE. We will save the details of QE for another article, but the general idea is that the government would print money and inject it into the system to stimulate the economy. QE has resulted in the “printing” of trillions of dollars and, as a result, the Monetary Base (known as M0) has increased exponentially (see Figure 1 below).
Figure 1: Monetary Base (Millions of Dollars)
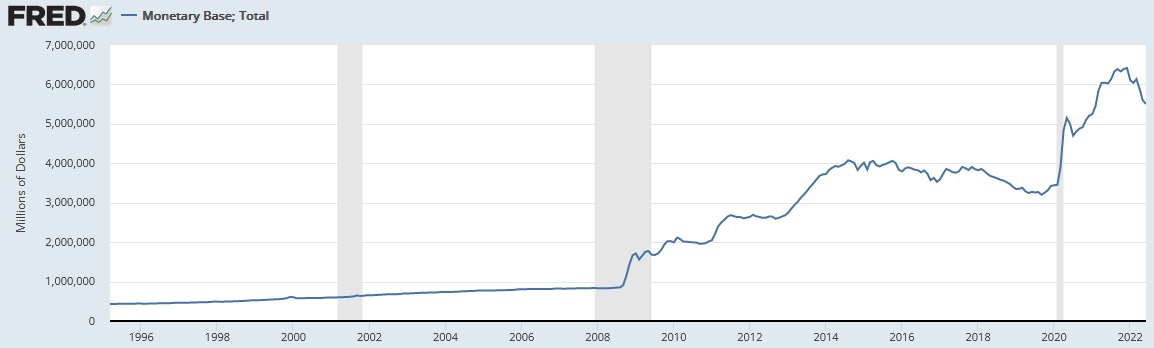
The moment QE began (way back in 2009), fiscal conservatives have been ringing the alarm bell that “hyperinflation” is inevitable, but it never manifested until now, or so the story goes.
Does today’s inflation make those alarmists right? It seems to fit Dr. Friedman’s definition pretty well, doesn’t it?
On the surface, it would seem that the theory was correct, albeit delayed, but when you dig deeper into the data, you can see that this theory is, in fact, wrong. The flaw in this theory is that it assumes that the money “printed” during the various rounds of QE was actually put into the system for consumers to spend, but it wasn’t. Depicted in Figure 2 below, the majority of the money produced through QE sat on bank balance sheets and never actually ended up in the hands of consumers. This continues to be true today.
Figure 2: Reserves of Depository Institutions (Billions of Dollars)
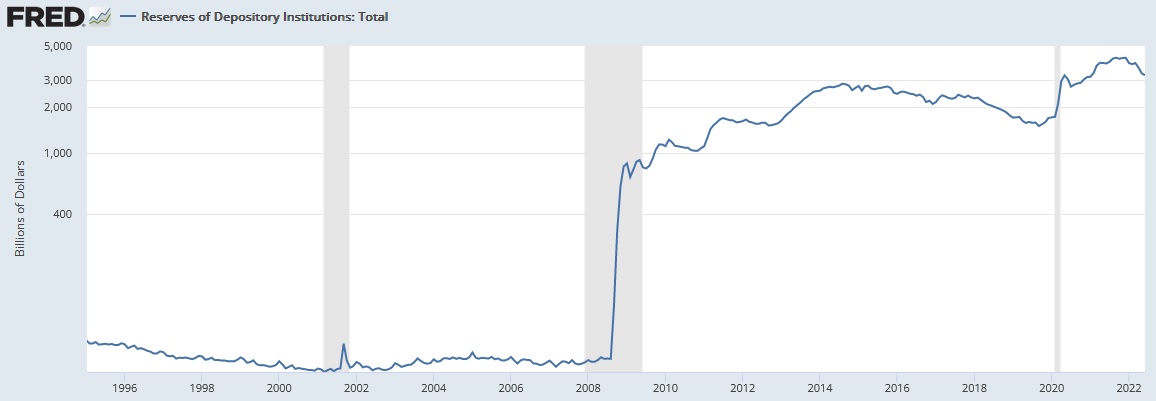
(Notice how eerily similar Figure 1 and Figure 2 actually are.)
There are a variety of reasons why this phenomenon took place, which I won’t get into here, but the result is that banks are flush with cash reserves that they never lent out. If money never gets into the hands of consumers, inflation cannot take place.
Even though the monetary base increased drastically over the last decade, it doesn’t meet Dr. Friedman’s definition of inflation because very little of the printed money “chased any goods”. This doesn’t mean that QE and the drastic increase in the monetary base didn’t have any effect on our economy, it just means that it isn’t the primary source of the inflation we are experiencing today.
COVID Era Stimulus Money
There is a component of the Money Supply that is hard to identify by looking at a graph of the monetary base or depository reserves, which we can refer to as the COVID Stimulus. The COVID Stimulus is very different than QE, as it was money put directly into the hands of businesses and consumers via fiscal policy and monetary policy. This included things like the Paycheck Protection Program, Stimulus and Relief Packages 1-5, Lost Wages Assistance Program, multiple housing and rental assistance programs, and various other loan facilities.[2]
The COVID Stimulus was given to many people who were in dire need of help due to the pandemic and subsequent lockdown of the US economy. However, it was also given to many people and businesses who were not in need, and this money, which totaled in the trillions, was unable to really be spent until the economy re-opened. Therefore, it was saved and accumulated, waiting to be spent in the form of pent-up demand, which it was (with childlike disregard). This portion of the Monetary Base absolutely meets Dr. Friedman’s definition of “too much money” and continues to be a contributor to the inflation we are experiencing today.
Supply of Goods
Now, we have identified what role the money supply has played in the current inflationary environment, but the second part of this equation is “too few goods” or the lack of a supply of goods and services. When there is “too much money” in the system, it tends to affect the inflation of all goods and services at a similar level (a rising tide lifts all ships, if you would). Supply constraints tend to be much more industry- or product-specific and results in certain categories of items experiencing inflation at a much higher level than others. Although we are seeing inflation to some extent across most categories, there are specific categories that have experienced inflation at a much higher level, which is due to a lack of supply of these products and services.
The PCE (Personal Consumption Expenditure Index), which is what the Federal Reserve uses to gauge inflation, was up 6.3% in May, from the year prior[3]. Meanwhile, Core PCE, which excludes food and energy, was only up 4.7%, from the year prior[4]. This makes a lot of sense considering that food and energy are two categories that have experienced much higher rates of inflation than the broader economy, due to shortages and supply chain issues, and are not included in Core PCE. The June annual inflation estimate for food and energy is 10.4% and 41.6%, respectively, which explains why Core PCE is so much lower than the broader measure of PCE.
As we dig into the data, we find different categories of products and services experiencing very different levels of inflation due to their availability. For example, televisions, computers, smartphones, watches, some apparel products, some beef products, and several other product categories have all declined in price over the past year[5]. Meanwhile, other categories, such as anything to do with automobiles, are experiencing double digit rates of inflation. This phenomenon is directly caused by shortages and supply chain constraints. Figure 3 below depicts the incredible shortage we are seeing in the automobile industry.
Figure 3: Auto Inventory/Sales Ratio (Ratio)
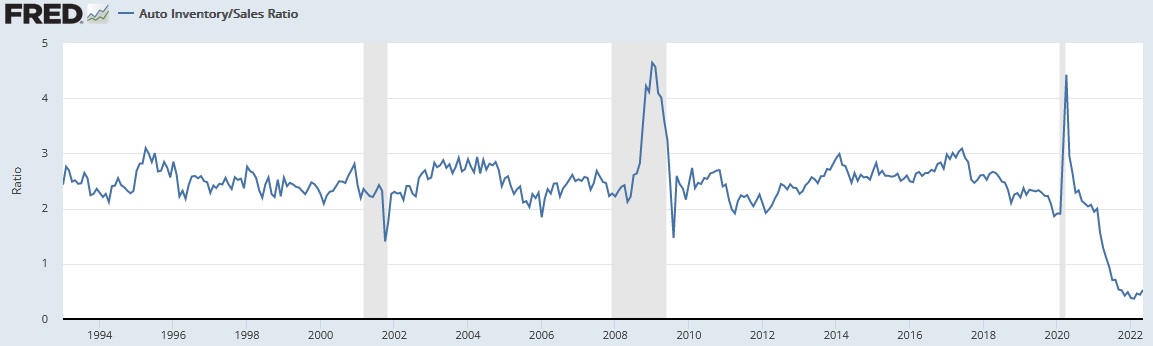
Inventories of automobiles are so low that it is affecting the demand for all things automotive and resulting in high inflation across the entire category.
This type of “uneven” inflation can be seen across numerous product categories as direct result of product shortages, due to COVID era economic policy around the world.
Putting the Pieces Together
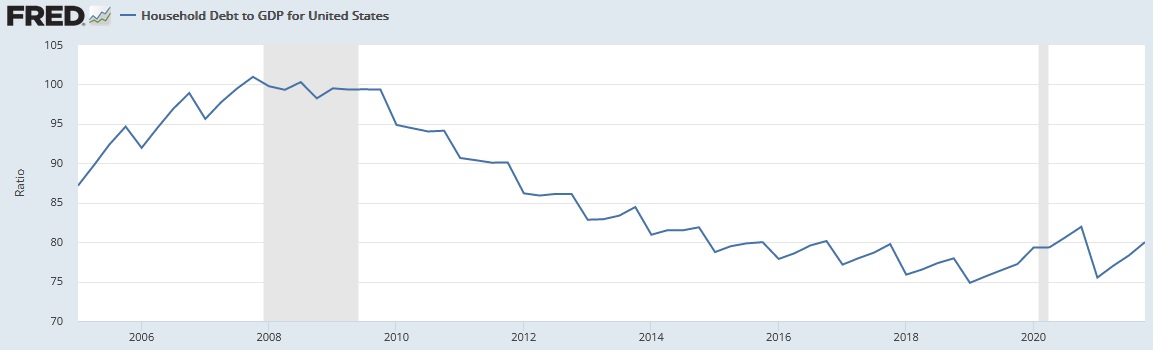
Based on the data at hand, we can conclude that there are two major components contributing to the current inflationary environment: the COVID Stimulus and supply shortages. We can also conclude that the inflation we are experiencing is not caused, in large part, by QE (printing of money) or an overheating economy that results in excess lending and leverage (see Figure 4 below).
Figure 4: Household Debt to GDP (Ratio)
I hate to use the word “transitory” when discussing inflation because it has been so misunderstood, but both major components of the inflation we are experiencing appear to be, in fact, transitory. What I mean is that, eventually, the COVID Stimulus money will run out and supply chains and manufacturing will return to full swing. With that said, “transitory” doesn’t mean next week or next month. This stuff takes a lot of time, but within the next 12-18 months, barring any more extreme lockdowns or policy missteps, most of the existing issues are likely to resolve themselves.
Inflation and The Role of the Federal Reserve
The current narrative is that, by raising the Federal Funds Rate, the Federal Reserve will be able to quell inflation by slowing consumer demand. There are two problems with this thesis.
First, the Federal Funds Rate, which is one of two rates the Federal Reserve controls, is a short-term rate that represents the interest rate banks pay one another for overnight lending. The Fed Funds Rate does affect the Prime Rate, which has some impact on consumer interest rates, but that’s about it. The Federal Reserve has no control over other interest rates, such as mortgages, auto loans, longer term business loans, and many others. These rates are set directly by the market and the increase in the Fed Funds Rate only influences these other rates by proxy. In other words, when a bank is assessing a potential loan, the Fed Funds Rate is one of the risk-free rates they use as comparison. A bank wouldn’t lend out money to a consumer at a rate that was lower than what they could get just lending to another bank at the Fed Funds Rate. Any increase we have seen in other interest rates is, believe it or not, coincidental. Not to mention that the effect of an increase in the Federal Funds Rate takes months to show up in the real economy. Any impact that a rate hike today has on consumer demand won’t be felt for quite some time.
Second, the data clearly shows that excess demand has very little to do with current levels of inflation. The Federal Reserve has zero ability to affect supply chains or remove the excess COVID Stimulus from the economy. Thus, any action taken by the Federal Reserve appears to be placation, they want to be seen as “doing something”.
The only thing that the Federal Reserve can really do to slow inflation is hike rates very high and very fast in hopes to invert the yield curve and thrust the US, and maybe the world, into a true recession. Even if they walk down this path, it typically takes between 12 and 18 months after a sustained yield curve inversion for the economy to experience a recession. By that time, the factors causing inflation will likely be a thing of the past and we will have been put into a recession for no real reason, although I imagine the Federal Reserve will claim victory, regardless. I have a really hard time fathoming that this is the goal of the Federal Reserve.
Analysis of Actions
If my perception is correct, it means the Federal Reserve knows it cannot truly slow inflation and is doing its best to please the powers that be and appear to be “taking action” without causing too much damage to the economy. Likely biding their time until the transitory factors disappear on their own. This brings us to the final point of why the Federal Reserve would allow themselves to be political pawns and play what appears to be a very dangerous game.
The answer is far simpler than you might think. The 12 board of governors of the Federal Reserve are appointed by politicians to 14-year terms and the Federal Reserve Chair is selected among the board members by a politician for a four-year term[6]. The length of these terms, and hopes to one day be appointed Chairman, means that the Federal Reserve and its members must constantly work with, and please, both political parties. They Federal Reserve, and its members, need to be seen as “taking action” in order to play their role in the game of politics. The Federal Reserve is supposed to be outside of political influence, but they are far from it. They walk a fine line of doing their job well without biting the hand that feeds them.
With any luck, they will be able to walk this line without causing too much damage. If they are able to accomplish this feat they will no doubt be hailed as heroes, regardless of the fact that more harm was done than good.
We know that there is a lot that has been left unsaid and undefined in this article. Analysis like this is incredibly complex and defining every term and concept would likely take an entire book rather than a single article. If you have questions or are trying to understand how this may affect your retirement plan, please get in touch with us, we are always happy to chat.
Previous – Market Myths Series #2: A Recession is Imminent
Coming Soon – Market Myths Series #4: You Shouldn’t Own Bonds During Times of Inflation
[1] https://www.goodreads.com/quotes/7781408-inflation-is-caused-by-too-much-money-chasing-after-too
[2] https://www.investopedia.com/government-stimulus-efforts-to-fight-the-covid-19-crisis-4799723
[3] https://www.bea.gov/news/2022/personal-income-and-outlays-may-2022
[4] https://www.bea.gov/data/personal-consumption-expenditures-price-index-excluding-food-and-energy
[5] https://www.bls.gov/news.release/pdf/cpi.pdf
[6] https://www.federalreserve.gov/aboutthefed/organization-charts.htm